Identity Is An Inference Problem
What fraud, AI systems, and uncertainty can teach us about trust

In an increasingly interconnected world, access to reliable, up-to-date country-level data has never been more crucial. Whether you’re conducting global research, working on international business strategies, or developing captivating visualizations, the need for comprehensive, easily accessible data on countries is universal. That’s where the tidycountries R package comes in, a tool designed to bring simplicity and efficiency to the way we work with global data.
At its core, tidycountries provides a user-friendly interface to access a wide array of country-level data, including country names, regions, populations, currencies, and more, all presented in a tidy format. This package is designed to fit seamlessly within the tidyverse ecosystem, making it effortless to manipulate, filter, and analyze data using popular R tools like dplyr and ggplot2.
But why is this so important?
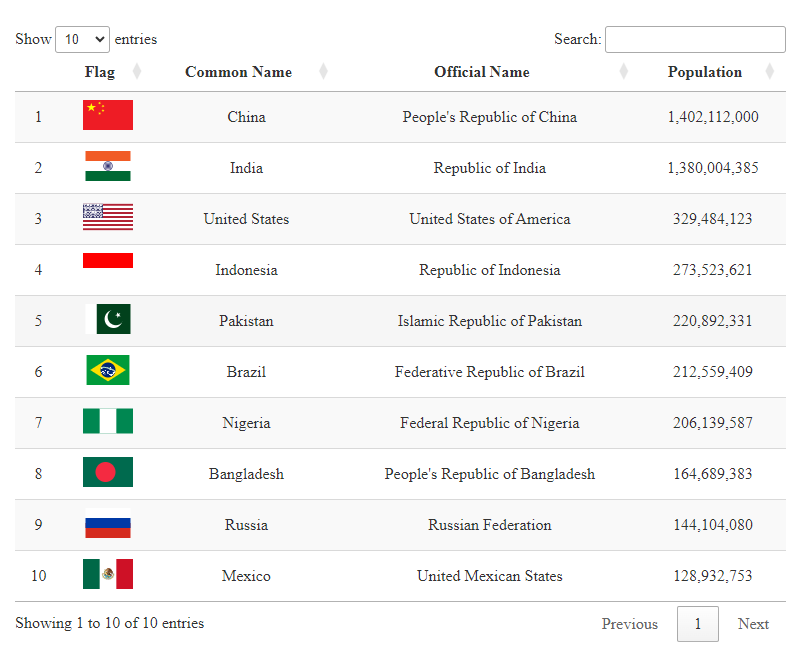
Let’s say you’ve been tasked with creating a global report on the 10 most populated countries, highlighting key demographic characteristics. Not only do you need to retrieve accurate data on populations and regions, but your presentation also needs to stand out and communicate clearly. By using tidycountries, you can quickly gather all the necessary country data, and even better, you can include national flags as part of your data visualization. These visual cues add a layer of engagement and clarity to your report that’s hard to achieve through numbers alone.
Flags, beyond being national symbols, are powerful tools in data communication. They instantly make global reports more accessible, making the data resonate with audiences on both visual and intellectual levels. Imagine seeing the Chinese flag alongside its population data, immediately, your data feels more meaningful and complete.

Tidycountries is just getting started. The package currently aggregates country-level information, but the future holds even more exciting possibilities. One major goal is to connect tidycountries to global data sources such as the World Bank, UN, and other major international databases. This would allow users to enrich their analysis with real-time economic, social, and environmental indicators, all within the same framework.
This planned integration will unlock an even wider range of applications, from predicting global trends to providing in-depth country comparisons across various sectors like education, healthcare, and economic development.
Although tidycountries is an R package today, we’re committed to expanding its reach by developing a Python version. We understand the importance of cross-platform tools, especially in a world where both R and Python are dominant languages in data science. By making tidycountries accessible to Python users, we’re opening the door to a much broader audience, ensuring that more people can benefit from the ease and comprehensiveness of this tool, regardless of their programming preference.
Another exciting aspect of tidycountries' future is the potential to link the package directly to our API. With this API connection, users will be able to automate updates, ensuring they always have the latest country-level data. Whether it’s for real-time analysis, updating dashboards, or creating dynamic reports, the integration with external APIs will make tidycountries even more powerful, helping users stay ahead in an ever-evolving world.
Tidycountries isn’t just a data package, it’s a gateway to global insights. By simplifying access to country-level data, enhancing visual communication with flags, and planning future integration with major data sources, tidycountries is set to become an indispensable tool for anyone working with international datasets.
We invite you to explore the possibilities by trying tidycountries for yourself. Whether you’re a researcher, a data analyst, or simply someone who needs to present global information, tidycountries will save you time and add depth to your analysis.
Check out the GitHub repository for more details and installation instructions:
Join the community and get new insights delivered to your inbox.